Monitors
Monitors are how we detect a problem or misconfiguration for an application. They are usually watching a service, a file, or a scheduled script.
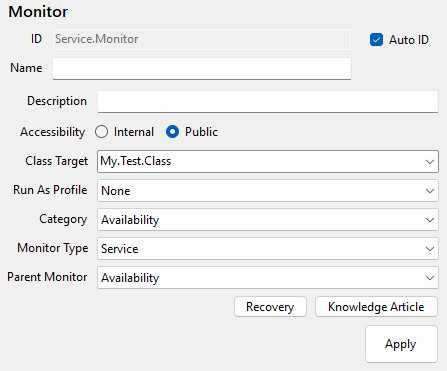
The following fields are on all monitors.
| Field | Description |
|---|---|
| Class Target | The class that has something that we want to monitor. |
| Run As Profile | The RunAs Profile SCOM will use on the Class Target to do the monitoring. If None is selected then the default RunAs profile configured on the Management Server will be used. |
| Category | The category for this monitor. |
| Monitor Type | The type of monitor to create. |
| Parent Monitor | We can select dependencies or aggregates here. The default parent is the Category selected. |
The Recovery button will take you to the Recovery for the monitor, or prompt to create new one.

Some monitors also have a Frequency of how often the Monitor will check the Class Target. The default values vary depending on the monitor. Most are about 30 seconds.
Categories
There are 4 overall categories to choose from for monitoring.
| Category | Description |
|---|---|
| Availability | This category is for checking if an application is running aka available to users, for example. |
| Configuration | This category is for checking if an application is properly configured. An application can be running and accessible by users, but sometimes misconfigured. |
| Performance | This category is for checking how an application is performing. An application may be working properly and properly configured but might be processing data slowly. |
| Security | This category is for checking for things that, if configured in a certain way, may pose be a security risk. |
Generating Alerts
Each monitor needs to be configured separately for when they alert.
| Field | Description |
|---|---|
| Generate alerts | Whether or not this monitor will trigger an alert. |
| Alert on State | The state the monitor needs to be in for the alert to trigger. |
| Alert Priority | How important the alert is to be addressed by an administrator. |
| Alert Severity | How critical to the monitored system is this failure. |
| Auto Resolve | When the monitor returns out of an unhealthy state, the alert should resolve itself. |
| Alert Name | The name of the alert displayed. |
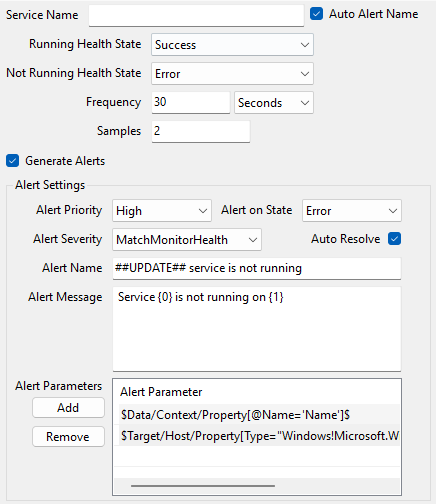
| Alert Message | The details about the alert. In the Service example image below, we have two parameters used in the message. Parameters index {0} and {1}. |
| Alert Parameters | We can put dynamic information in the alert message about the affected service or system. The parameters directly correspond to the numbers surrounded by curly brackets '{}' in the order they are listed in the parameters list. Research SCOM context variables for available options. |
Note: It may be necessary to configure a monitor not to alert. We would typically do this in cases where a monitor is in an unhealthy state, but we may only want to alert at the parent aggregate level instead.
Monitor Types
The rest of this section describes each monitor type supported by YAMPAT.
Service
The service monitor watches for a service to be running.
| Field | Description |
|---|---|
| Service Name | The name of the service to monitor on the Target Class. This must be the actual name of the service, NOT the display name seen in the Services MMC console. Look at the properties of the service to get the real service name. |
| Running Health State | The state the monitor is in when the service is running. |
| Not Running Health State | The state the monitor is in when the service is not running. |
| Samples | The number of samples to collect before the Health State changes. |
PowerShell
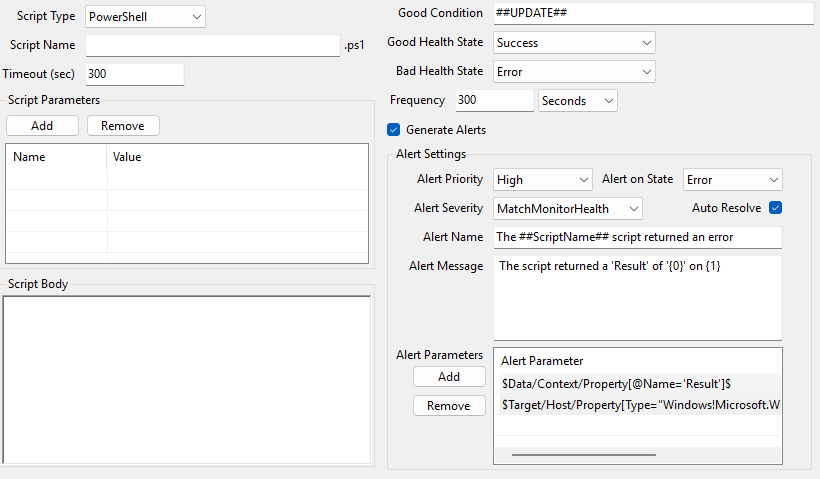
This monitor will run a PowerShell script on the Class Target to check for a problem.
Use the right-click menu to select a basic script template. The script should write a value to the Result property bag variable and must match the 'Good Condition' value.
Event Log
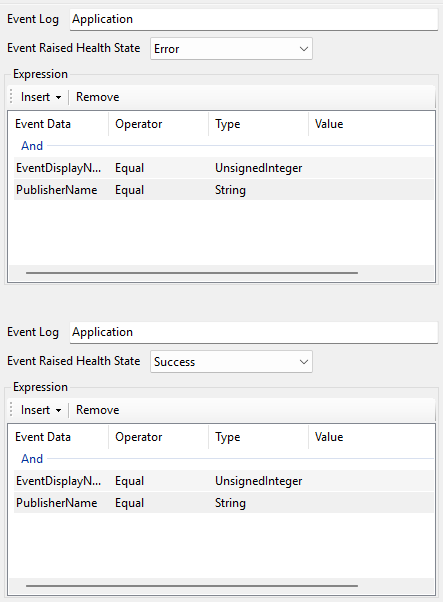
There are 3 event log monitors to choose from.
- Event Reset - (Shown in the image below.) This event monitor has two events it's looking for. One to detect when something is wrong, and another to detect when the error has recovored.
- Manual Reset - This event monitor only checks for a single event. If an alert is triggered, it must be manually reset using the Health Explorer in the SCOM Console.
- Timed Reset - This event monitor only checks for a single event. And will automatically reset to Healthy after a defined time period.
Process
This monitor will check if a particular process is running on the monitored Class Target.
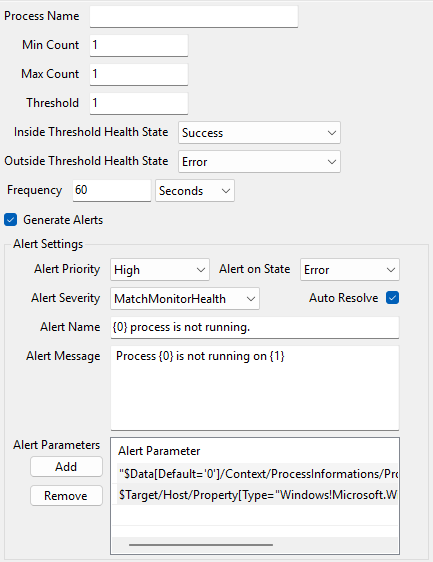
| Field | Description |
|---|---|
| Process Name | The name of the process to look for. |
| Min Count | The minumum amount of those processes to be expected on the Class Target. |
| Max Count | The maximum amount of those processes to be expected on the Class Target. |
| Thershold | The amount of times this monitor can break the threshold before a Health State change is triggered. |
| Inside Threshold | The Health State the monitor should switch to when within the threshold of expected values. |
| Outside Threshold | The Health State the monitor should switch to when the expected values re not found. |
Aggregate
An aggregate is essentially a parent monitor that allows you to trigger an overall alert for an application. For example, if an application has multiple services that need to all be running for the application to run properly, we may want to use an aggregate. We can configure that aggregate so that we get an alert if ANY of the child monitors are unhealthy, rather than get an alert for each monitor. This can greatly reduce the number of alerts that are triggered for an application. The downside is that you don't get to see the specific monitor that triggered in the alert. You would need to open the Health Explorer in the SCOM Console to see the child monitor details.
There is only one setting for aggregates, the algorithm, and it has two options.
| Algorithm | Description |
|---|---|
| Worst Of | The aggregate will alert on the worst state of any of the child monitors. This is usually the option you would select. |
| Best Of | The aggregate will alert on the best state of all the child monitors. This is for cases where all of the children monitors need to be in alert state for the aggregate to alert. |
Dependency
This documentation is still being worked on. In the meantime see Microsoft's documentation or other online resources.
| Algorithm | Description |
|---|---|
| Worst Of | If this option is selected, the aggregate will alert on the worst state of any of the child monitors. This is usually the option you would select. |
| Best Of | If this option is selected, the aggregate will alert on the best state of all the child monitors. This is for cases where all of the children monitors need to be in alert state for the aggregate to alert. |
| Percentage | If this option is selected, the aggregate will alert on the best state of all the child monitors. This is for cases where all of the children monitors need to be in alert state for the aggregate to alert. |